






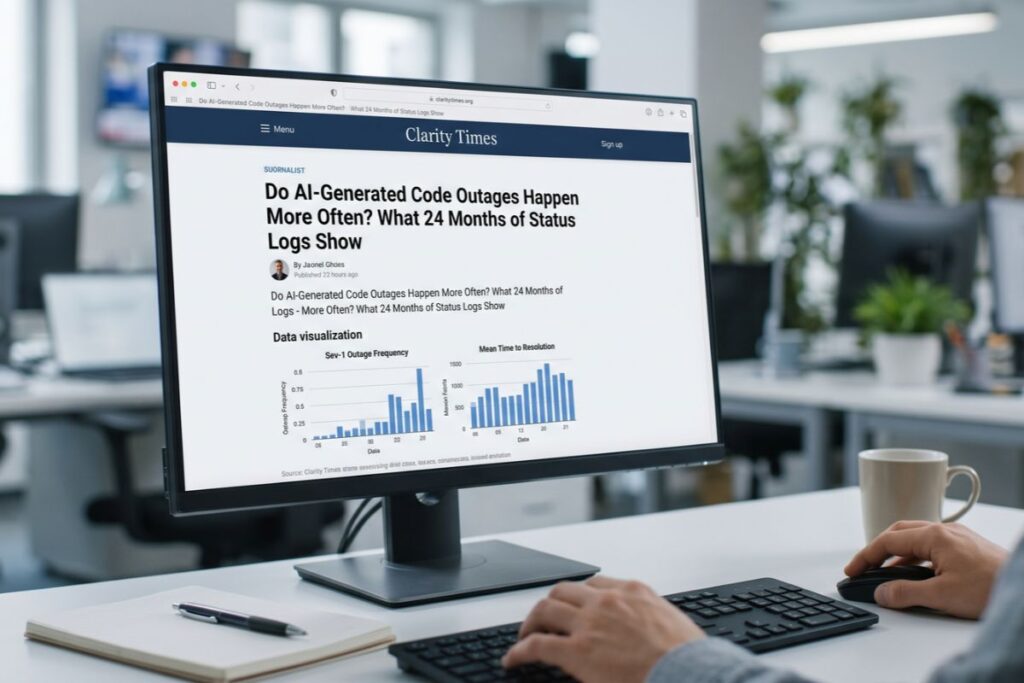
Tech companies reporting heavy use of AI-generated code did not suffer more frequent AI-generated code outages than low-disclosure peers over the past 24 months, according to a Clarity Times review of public status archives and executive filings. Instead, when configuration bugs slipped into production, high-AI-adoption providers took longer to restore service as code churn outpaced human review capacity.
Does Higher AI Code Share Increase Sev-1 Outage Frequency?
No: comparing 24 months of public cloud and software-as-a-service (SaaS) status logs against executive AI disclosures shows no corresponding spike in Sev-1 incident frequency among providers reporting 30% to 75% AI-written code. A Sev-1 (Severity 1) outage is a critical service failure that halts core operations for customers with no immediate workaround.
The Clarity Times review examined incident histories from late 2024 through November 2026 across the AWS Health Dashboard, Google Cloud Service Health, Microsoft 365 Service Health, Cloudflare Incident History, and GitHub Status. While total severe outage counts stayed flat across high-disclosure providers, mean time to resolution (MTTR), the average time from outage detection to full service restoration, lengthened on software configuration failures.
According to Faros AI’s 2026 AI Engineering Report, which analyzed 22,000 developers across more than 4,000 teams, high AI adoption expands pull-request size by 51% and increases incidents per pull request more than threefold as code churn, the rate at which recently written code is rewritten or deleted, strains engineering triage.
Public executive statements establish the upper tier of AI code adoption during this 24-month window. Alphabet CEO Sundar Pichai reported that AI-generated “new code” at Google rose from roughly 25% in late 2024 to over 30% in April 2025, reaching 75% by April 2026. Microsoft CEO Satya Nadella stated in April 2025 that 20% to 30% of code in Microsoft repositories was written by software, a disclosure followed ten months later by Microsoft’s appointment of a dedicated engineering quality chief to lead multi-month reliability efforts.
Why Do “75% AI Code” and “25% AI Commits” Measure Different Things?
Executive AI figures and independent repository audits measure different stages of software production: executives count suggested lines accepted inside developer editors, while repository audits count merged commits across entire codebases.
Third-party telemetry records lower adoption rates than executive announcements suggest:
- GitClear: According to GitClear’s analysis of 623 million code changes, block duplication climbed 81% between 2023 and 2026, from 40.3 to 73.0 duplicated blocks per million changed lines, while code refactoring fell from 21% in 2022 to 3.8% in 2026.
- DX: Telemetry from DX covering more than 135,000 developers across 435 companies recorded 22% merged AI-authored code alongside 60% higher pull-request throughput for daily users.
- Jellyfish: A Jellyfish survey of more than 600 engineering leaders across over 700 client organizations found 64% reporting at least a 25% gain in developer velocity, even as DX capacity research noted that a 180% jump in commit volume attenuated to 20% to 30% actual software releases due to downstream review bottlenecks.
Cross-tabulating those benchmarks with earnings-call disclosures shows that total codebase turnover, not the headline AI percentage alone, correlates with deployment instability. A company generating 75% new code via AI inside isolated greenfield tools faces a different risk profile than a provider rewriting legacy routing logic at high speed.
Why Did Outage Counts Stay Flat While Recovery Times Slowed?
Automated pre-launch testing blocks routine AI syntax errors before release, keeping incident counts flat, while complex configuration regressions bypass automated gates and take longer to diagnose once deployed.
Disaggregating major 2025 and 2026 cloud disruptions by root cause shows why outage frequency held steady. External physical disruptions, such as the March 2026 regional infrastructure damage documented on the AWS Health Dashboard in the UAE, account for a baseline of incidents unrelated to software authoring.
On routine software deployments, automated continuous integration and continuous delivery (CI/CD) pipelines, automated systems that test and release code, blocked standard syntax errors before launch. Engineering leaders point to steady uptime across core services, such as GitHub’s 99.98% to 100% monthly uptime, alongside rising daily commit volumes as evidence that automated testing catches common defects before customers see them.
Configuration regressions, however, slipped past pre-launch gates and extended recovery windows:
- Amazon Web Services (October 20, 2025): A latent race condition in Amazon DynamoDB’s automated DNS management system triggered a cascading disruption in US-EAST-1 lasting more than 15 hours.
- Microsoft Azure Front Door (October 29, 2025): An inadvertent control-plane configuration change disrupted global access to Microsoft 365 and Azure portals for nearly eight hours.
- Cloudflare (November 18, 2025): A database query change produced duplicate rows in an auto-deployed Bot Management configuration file, crashing core proxy traffic for five hours and 46 minutes.
Independent research aligns with this pattern. According to a CodeRabbit analysis of 470 open-source pull requests, AI-authored changes introduced 1.7 times more total issues, 10.83 issues per pull request versus 6.45 for human-only submissions, and 75% more logic errors. Meanwhile, a randomized controlled trial by METR found experienced open-source developers took 19% longer to complete tasks on complex, familiar codebases when using AI tools due to debugging and verification overhead, despite estimating afterward that AI had sped them up by 20%.
What Do Public Cloud Status Pages Leave Out?
Vendor-hosted status pages omit many localized slowdowns and partial API timeouts because providers set their own thresholds for what qualifies as a public incident. Auditing vendor status archives against external synthetic monitoring, automated probes that test website and API availability from outside networks, exposes gaps in public reporting.
Cross-checking vendor status histories against the ThousandEyes Internet Outages Map, which tracks billions of daily network and application measurements across 124 SaaS platforms, captures regional packet loss and API timeouts, such as localized routing stalls on June 10, 2026, and September 16, 2026, that frequently register as minor advisories or pass unlogged on public status dashboards.
Corporate filings reflect operational exposure more directly than status dashboards. According to an analysis by Context Analytics of 2026 SEC Form 10-K filings, 57% of public companies now cite AI-specific risks, up from boilerplate mentions five years earlier, with 381 filings flagging third-party AI model dependencies and 177 explicitly warning investors about model hallucinations and flawed outputs disrupting operations.
Where Does the Engineering Bottleneck Actually Sit?
The reliability bottleneck sits in human code review and verification, not code generation, because organizations have not expanded senior quality-assurance or site reliability engineering (SRE) headcount to match AI-driven commit volume. Site reliability engineering (SRE) is the discipline of applying software engineering practices to automate infrastructure operations and maintain system uptime.
Labor and engineering benchmarks illustrate this structural squeeze:
- DORA benchmarks: Google Cloud’s 2025 State of AI-assisted Software Development report found that AI acts as an amplifier of existing engineering discipline, raising delivery throughput only when teams pair it with strict automated verification rather than letting review queues absorb the extra volume.
- Review bottlenecks: According to Faros AI’s code-review telemetry, median pull-request review time jumped 441.5% under high AI adoption, alongside a 31% increase in pull requests merged with no review at all.
- Hiring trends: Research from the Stanford Digital Economy Lab analyzing Automatic Data Processing (ADP) payroll records through mid-2026 shows employment for young workers ages 22 to 25 in AI-exposed occupations stands 19% below trend, narrowing the entry-level pipeline that traditionally handled routine test coverage and initial code triage.
For enterprise buyers evaluating cloud vendors, raw AI code-generation percentages offer little predictive value on their own. The measurable indicator of future outage duration sits in how a provider staffs and automates verification after the code is written.
Frequently Asked Questions
Do tech companies using more AI-generated code have more frequent outages?
No. A 24-month review of public cloud status logs from late 2024 through November 2026 shows that providers reporting 30% to 75% AI-generated code did not experience higher Sev-1 outage frequency than low-disclosure peers. Automated continuous integration and continuous delivery (CI/CD) pipelines catch routine syntax errors before release, keeping overall severe outage counts flat.
How does AI-generated code affect outage recovery times?
When configuration bugs bypass pre-launch checks, high-AI-adoption providers experience longer mean time to resolution (MTTR). According to Faros AI telemetry, high AI adoption expands pull-request size by 51%, drives a 441.5% jump in median pull-request review time, and increases incidents per pull request more than threefold as code churn outpaces human review capacity.
Why do executive AI code percentages differ from independent developer telemetry?
Company executives typically report the share of suggested code lines accepted inside internal developer editors, such as Alphabet CEO Sundar Pichai citing 75% AI-generated “new code” in April 2026, while independent audits measure merged commits across entire repositories. Telemetry from DX across 135,000 developers recorded 22% merged AI-authored code, and GitClear’s analysis of 623 million changes tracked roughly 25% AI assistance.
What do public cloud status pages miss about AI-era reliability?
Vendor-hosted status dashboards omit many localized slowdowns and partial API timeouts because providers define their own reporting thresholds. External synthetic monitoring from ThousandEyes captures regional routing stalls missed on vendor dashboards, while 2026 SEC Form 10-K filings analyzed by Context Analytics show 177 public companies explicitly warning investors about flawed AI outputs disrupting operations.