






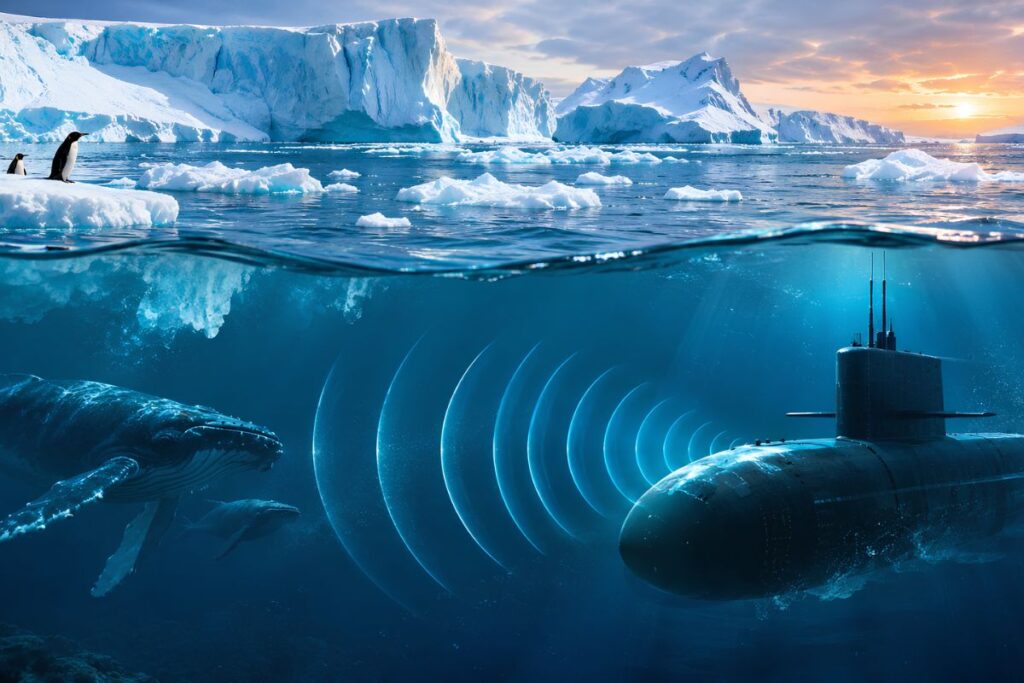
How Does the Antarctic Intermediate Water Salinity Shift Alter Underwater Sound?
Rising salinity, warming, and sinking in a Southern Ocean water layer between 700 and 1,200 meters alter underwater sound speed and bending angles. As this denser layer drops deeper, it lowers the ocean’s natural sound channel, shifting the acoustic blind spots and listening paths used by submarines, nuclear monitors, and whale researchers.
Across the Southern Hemisphere, that 700-to-1,200-meter depth band is occupied by a water mass known as Antarctic Intermediate Water (AAIW), a sub-surface ocean layer formed near the polar front that flows northward into the Indian, Pacific, and Atlantic oceans. AAIW sits at the exact depth of the deep sound channel, formerly called the SOFAR (Sound Fixing and Ranging) channel.
The SOFAR channel works like a fiber-optic cable for sound. Above its axis, warmer surface water speeds sound up; below it, crushing deep-ocean pressure also speeds sound up. Sound waves naturally bend toward the slowest layer in the middle, trapping low-frequency acoustic signals inside the 700-to-1,200-meter band and carrying them thousands of kilometers without hitting the sea surface or ocean floor.
Because AAIW forms the physical core and lower floor of this waveguide across mid-latitude southern oceans, any structural change to the water mass changes how sound bends. Detailed hydrographic evidence mapping these changes across the southern Indian Ocean sector between 30°S and 50°S is cataloged in the Roemmich-Gilson (RG) Argo and EN4 gridded datasets maintained by international oceanographic centers.
Physical oceanographers analyzing these profiles at research institutions such as the Woods Hole Oceanographic Institution (WHOI) model how the downward displacement of the AAIW lower boundary alters vertical sound-speed gradients in the southern Indian and Pacific sectors.
Why Does Sinking Water and Coupled Warming Change Sound Speed More Than Salt Alone?
The physical shift driving these acoustic changes was documented in October 2026 in Nature Climate Change by Kaushik Mishra and Bishakhdatta Gayen of the Indian Institute of Science and the University of Melbourne, alongside Alberto Naveira Garabato of the University of Southampton. Analyzing three decades of satellite records and robotic Argo float profiles, the team found that a 20% to 30% reduction in summer Antarctic sea-ice meltwater since 2016 reversed a 22-year freshening trend (1993–2015), raising AAIW salinity by 0.0048 grams per kilogram per decade and causing the denser layer to sink deeper.
That seasonal sea-ice loss is distinct from melting land glaciers and continental ice shelves, which dump freshwater into coastal seas and freshen the abyssal ocean floor below 3,000 meters. Offshore, reduced northward drift of seasonal sea ice starved the mid-ocean of summer freshwater, leaving the 700-to-1,200-meter AAIW layer saltier and heavier.
In underwater acoustics, however, a salinity increase of 0.0048 grams per kilogram is minuscule on its own. Under the standard nine-term Mackenzie and 1995 UNESCO (Chen and Millero) seawater acoustic equations, sound velocity increases by three main factors:
- Salinity: roughly 1.3 meters per second for every 1 gram per kilogram increase in salt content.
- Temperature: roughly 4.5 meters per second for every 1 degree Celsius of warming.
- Depth (pressure): roughly 0.017 meters per second for every 1 meter of downward depth increase.
Based on those physical constants, a standalone salinity rise of 0.0048 grams per kilogram adds less than 0.01 meters per second to underwater sound speed, from a typical SOFAR minimum of 1,475.00 meters per second to under 1,475.01 meters per second. The real acoustic shift comes from two coupled processes documented in Figures S3 and S4 of the Nature Climate Change study’s supplementary data: “spice” (simultaneous warming and salinification along surfaces of equal density) and “heave” (the physical sinking of those density surfaces to greater depths).
When a denser water mass sinks tens of meters deeper while carrying warmer, saltier water along its upper boundary, both the temperature gradient and the pressure gradient shift downward. Computational oceanographers model these shifts by applying the nine-term Mackenzie equation to the Mishra et al. supplementary datasets across the Indian and Pacific basins, computing the exact net change in sound velocity (c in meters per second) and SOFAR axis depth (z in meters) between 800 and 1,100 meters.
The statistical permanence of that post-2016 shift remains an open scientific question. In the study’s supplementary uncertainty analysis (Table S1 and the Pettitt breakpoint statistics in Figures S10 and S11), the authors show a sharp step-change between 2015 and 2017 rather than a smooth multi-decade curve, following a 1993–2015 freshening period that was itself driven by an unexpected two-decade expansion of Antarctic sea ice.
Study authors Kaushik Mishra, Bishakhdatta Gayen, and Alberto Naveira Garabato continue to evaluate whether multidecadal wind shifts, such as the Southern Annular Mode, could modulate or reverse the post-2016 AAIW deepening over the coming decade.
How Do AAIW Salinity Shifts Alter Submarine Convergence and Shadow Zones?
While the pan-Southern Ocean salinity increase averages 0.0048 grams per kilogram per decade, Figure 1 and Figure S11 of the Nature Climate Change dataset show that the steepest regional salinification and deepening occur in the southeastern Indian Ocean (between 30°S and 50°S) and the Tasman Sea. That geographic footprint sits directly across the deep-water transit corridors leading into HMAS Stirling near Perth, Western Australia, the primary rotational submarine hub for the AUKUS security partnership between Australia, the United Kingdom, and the United States.
In anti-submarine warfare, sonar operators rely on vertical sound-velocity profiles to predict two tactical features: convergence zones and shadow zones. Convergence zones are rings, typically spaced 50 to 65 kilometers apart, where sound rays refracted deep in the ocean bend back up to focus near the surface. Shadow zones are acoustic blind spots at mid-depths where sound rays bend away, allowing a submarine to hide from surface hull-mounted and towed-array sonar.
When the AAIW layer deepens and warms along density surfaces, the lower refraction boundary of the waveguide drops, changing both the horizontal distance at which convergence rings reach the surface and the depth floor of mid-water shadow zones. Environmental acoustic modeling data published by agencies such as the U.S. Office of Naval Research (ONR) quantify how a deeper AAIW axis shifts convergence-zone range predictions along strategic Southern Hemisphere transit routes.
Naval meteorological and oceanographic (METOC) specialists note, however, that modern submarine combat systems do not navigate strictly by static 20-year climatology charts. Submarines and surface patrol vessels routinely drop expendable bathythermographs, disposable wired probes that measure water temperature with depth, and ingest daily operational ocean forecasts such as the U.S. Navy’s Hybrid Coordinate Ocean Model (HYCOM) and Australia’s Bluelink system.
In day-to-day tactical operations, transient mesoscale eddies, swirling loops of warm or cold water tens of kilometers wide, and internal tides disrupt sonar bending angles far more than a decadal baseline drift. Even so, operational forecast models like HYCOM and Bluelink rely on historical seasonal climatologies as their background state outside the immediate radius of recent probe drops, and they depend on real-time satellite and Argo float transmissions to correct those baselines. Fleet documentation confirms that forecast accuracy degrades in Southern Ocean sectors where winter sea ice or fleet attrition restricts real-time Argo float coverage.
Why Does Cape Leeuwin’s Hydroacoustic Station Experience Calibration Drift?
Unlike mobile submarines that can drop local probes, fixed underwater listening stations must account for long-term changes in the water column between the source and the receiver. Off the southwestern tip of Western Australia, the Comprehensive Nuclear-Test-Ban Treaty Organization (CTBTO) operates hydroacoustic station HA01 at Cape Leeuwin,a triad of cabled underwater microphones moored inside the SOFAR channel depth band to detect low-frequency acoustic waves (1 to 100 Hertz) from clandestine underwater nuclear tests across the Indian and Southern oceans.
Because station HA01 is used not only for treaty verification but also for ocean acoustic thermometry, measuring basin-scale ocean changes by timing how long repeating sound signals from Antarctic ice-calving events and submarine earthquakes take to cross thousands of kilometers, shifts in the AAIW waveguide alter baseline acoustic arrival times and vertical arrival angles.
Publicly available hydroacoustic arrival-time logs and acoustic thermometry records from CTBTO International Monitoring System datasets track pre-2016 versus post-2016 travel-time trends across the southern Indian Ocean sector.
Acoustic tomographers working with CTBTO network data analyze whether the post-2016 AAIW density and depth shift can be isolated in HA01 calibration logs from louder short-term noise generated by the Agulhas Return Current and surface warming.
How Do Acoustic Shifts Impact Baleen Whale Bioacoustic Monitoring?
The same low-frequency physics governs scientific hydrophone networks tracking recovering populations of Antarctic blue whales and fin whales, whose calls sit between 15 and 28 Hertz. To estimate whale population density from passive acoustic moorings, marine bioacousticians run sound-propagation loss models that calculate how far away a calling whale can be heard before its signal fades into background ocean noise.
Those transmission-loss models require an accurate vertical sound-speed profile across the 700-to-1,200-meter AAIW layer to model how much acoustic energy stays trapped in the waveguide versus leaking into the seabed. Passive acoustic detection-range models and metadata archives from the Australian Antarctic Data Centre (AADC) provide baseline comparisons of detection radii under 1993–2015 freshened AAIW conditions versus post-2016 salinified and deepened AAIW profiles.
Marine bioacousticians at the Australian Antarctic Division (AAD) and university laboratories continue to evaluate the estimated percentage change in modeled detection range for 15–28 Hz baleen whale calls and whether historical multi-year acoustic abundance series must be recalibrated.
Both military sonar forecast models and civilian hydrophone networks share a single operational dependency: they can adjust to a deeper, saltier Antarctic Intermediate Water layer only if robotic Argo floats continue broadcasting real-time temperature and salinity profiles from the Southern Ocean’s seasonal ice zone.
Frequently Asked Questions
What is Antarctic Intermediate Water (AAIW) and why does it affect sound?
AAIW is a sub-antarctic water layer between 700 and 1,200 meters deep that occupies the ocean’s SOFAR sound channel. Because sound waves bend toward the slowest sound-speed layer in the middle of this waveguide, changes in AAIW temperature, salinity, and depth directly alter long-range acoustic propagation paths.
How much has AAIW salinity increased since 2016?
According to Mishra et al. in Nature Climate Change, a 20% to 30% reduction in summer Antarctic sea-ice meltwater reversed a 22-year freshening trend, increasing AAIW salinity by 0.0048 grams per kilogram per decade and driving the water mass deeper.
Why does a tiny salinity increase matter for submarine sonar?
While a salinity rise of 0.0048 g/kg adds less than 0.01 meters per second to sound speed on its own, it occurs alongside coupled warming along density surfaces (“spice”) and the downward sinking of the water layer (“heave”). Together, these processes depress the SOFAR channel axis and shift convergence-zone ranges and mid-water shadow zones.
How do naval forces account for these deep-ocean changes?
While static historical climatology charts are affected by decadal AAIW shifts, modern naval forces deploy expendable bathythermographs and ingest daily operational ocean models like the U.S. Navy’s HYCOM to update real-time vertical sound-speed profiles.
Does this water mass shift impact non-military ocean monitoring?
Yes. Fixed listening posts such as CTBTO hydroacoustic station HA01 at Cape Leeuwin and civilian hydrophone arrays tracking 15–28 Hz baleen whale calls rely on stable transmission-loss models that must account for baseline travel-time and detection-range drift across the modified AAIW layer.